Essay
Consider the following multiplier model diagram:
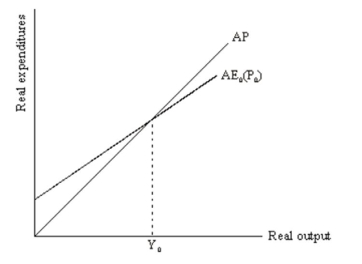 Demonstrate graphically (and explain your graph)what will happen in the picture when the price level increases.Link this diagram to the AD/AS model by showing the effects of an increase in the price level in the AD/AS model.Assume a horizontal SAS curve.
Correct Answer:

Verified
An increase in the price level to P1 > P0 ...View Answer
Unlock this answer now
Get Access to more Verified Answers free of charge
Correct Answer:
Verified
View Answer
Unlock this answer now
Get Access to more Verified Answers free of charge
Q15: For each of the following state
Q16: Suppose the government increases autonomous taxes (taxes
Q17: Assume that the economy is initially at
Q18: Consider the following multiplier model diagram:<br> <img
Q19: Consider a multiplier model in which autonomous
Q21: How is the level of income determined
Q22: What is the marginal propensity to expend?
Q23: Consider the following multiplier model diagram:<br> <img
Q24: Suppose the multiplier model is<br>C = C<sub>0</sub>
Q25: What is the difference between viewing the