Essay
Consider the following diagram
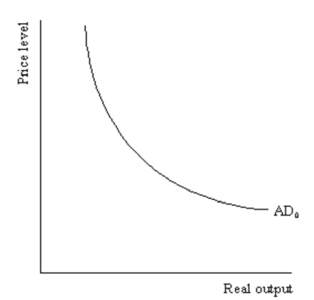 Demonstrate graphically and explain verbally the impact of a decrease of 50 in government spending on the AD curve in the diagram when the multiplier is 3.
Correct Answer:

Verified
Correct Answer:
Verified
Related Questions
Q1: Why is the short-run aggregate supply (SAS)curve
Q9: Suppose the economy is in an inflationary
Q19: Using an AS/AD diagram,demonstrate graphically and explain
Q53: What are the three ways that falling
Q72: Demonstrate graphically and explain verbally the comparison
Q124: What does aggregate demand management mean?
Q139: Demonstrate graphically and explain verbally the case
Q164: Explain why the long-run aggregate supply (LAS)curve
Q166: What are feedback effects,and how does the
Q182: Suppose that in order to win voter