Essay
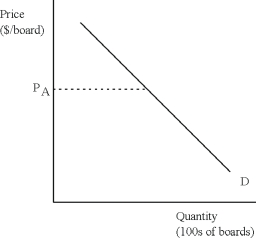
The diagram below represents the consumer side of the market for skateboards in New York.The current price of skateboards is PA.Each of the events described below will have some impact on the demand for skateboards.For each event,draw a picture to illustrate the effect of the event.Be sure to explain your pictures using pertinent economic terminology ("movement along" or "shift in").
 (a)A drop in the price of skateboards.
(b)A drop in the price of kneepads.
(c)A decline in income.
Correct Answer:

Verified
(a)The diagram:  A drop in the price of ...
View Answer
Unlock this answer now
Get Access to more Verified Answers free of charge
Correct Answer:
Verified
View Answer
Unlock this answer now
Get Access to more Verified Answers free of charge
Q6: What are the "other things constant" when
Q7: Consider the following supply and demand diagram
Q9: Given the following individual supply tables
Q10: Explain the following statement: "The invisible hand
Q11: The table below shows the quantity
Q15: A change in a shift factor of
Q19: How is the "Law of Demand" different
Q23: Demonstrate graphically and explain verbally the concept
Q24: Demonstrate graphically and explain the difference between
Q31: Explain what it means to say that