Essay
The diagram below represents the producer side of the market for skateboards in New York.The current price of skateboards is PA.Each of the events described below will have some impact on the supply of skateboards.For each event,draw a picture to illustrate the effect of the event.Be sure to explain your pictures using pertinent economic terminology ("movement along" or "change in quantity").
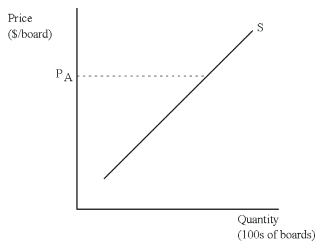 (a)A drop in the price of skateboards.
(b)An increase in the price of wheels used in the manufacturing of skateboards.
Correct Answer:

Verified
(a)The diagram:  A drop in the price of ...
View Answer
Unlock this answer now
Get Access to more Verified Answers free of charge
Correct Answer:
Verified
View Answer
Unlock this answer now
Get Access to more Verified Answers free of charge
Q7: Demonstrate graphically and explain verbally the concept
Q8: What are normal goods? What are inferior
Q16: John and Steve are roommates at Siberian
Q20: Stuffed-Crust Pizza is a new pizza introduced
Q24: Consider the following demand table,which represents
Q26: What is equilibrium? Explain what it means
Q27: Explain the error in the following statement:
Q28: What is meant by "the fallacy of
Q29: Given the following individual demand tables
Q30: In 2008,the price of soybeans was $3.50