Multiple Choice
 Refer to the graph above. A movement from point C to point D on the Laffer Curve represents:
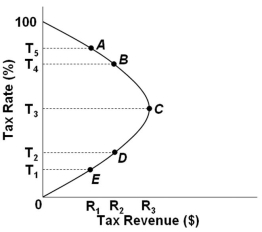
A) Increased tax rates from T2 to T3 and increased tax revenues from R2 to R3
B) Decreased tax rates from T3 to T2 and increased tax revenues from R2 to R3
C) Decreased tax rates from T3 to T2 and decreased tax revenues from R3 to R2
D) Increased tax rates from T2 to T3 and decreased tax revenues from R3 to R2
Correct Answer:

Verified
Correct Answer:
Verified
Q6: <img src="https://d2lvgg3v3hfg70.cloudfront.net/TB4895/.jpg" alt=" Refer to the
Q7: Economist Arthur Laffer argued that Robin Hood
Q8: <img src="https://d2lvgg3v3hfg70.cloudfront.net/TB4895/.jpg" alt=" Refer to the
Q9: In the long run, if the price
Q11: <img src="https://d2lvgg3v3hfg70.cloudfront.net/TB4895/.jpg" alt=" Refer to the
Q12: The experience of the U.S. with supply-side
Q13: <img src="https://d2lvgg3v3hfg70.cloudfront.net/TB4895/.jpg" alt=" Refer to the
Q14: <img src="https://d2lvgg3v3hfg70.cloudfront.net/TB4895/.jpg" alt=" Refer to the
Q88: A stable Phillips curve does not allow
Q158: The long-run Phillips Curve is essentially a