Multiple Choice
 Refer to the figure above. The massive increase in government spending during World War II moved the economy in the span of a few short years from mass unemployment and price stability to "overfull" employment. This situation can be best illustrated in the figure above as a:
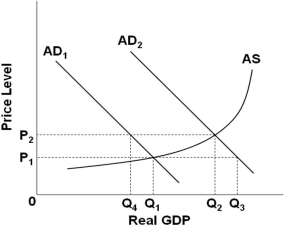
A) Shift from AD2 to AD1
B) Shift from AD1 to AD2
C) Movement along AD1 from Q4 to Q1
D) Movement along AD2 from Q2 to Q3
Correct Answer:

Verified
Correct Answer:
Verified
Q122: The foreign purchases effect on aggregate demand
Q123: An increase in productivity will:<br>A) Increase aggregate
Q124: A fall in labor costs will cause
Q125: The short-run aggregate supply curve:<br>A) Becomes flatter
Q126: <img src="https://d2lvgg3v3hfg70.cloudfront.net/TB4895/.jpg" alt=" Refer to the
Q128: If the price of crude oil decreases,
Q129: An increase in investment and government spending
Q131: If at a particular price level, real
Q132: The labels for the axes of an
Q251: The economy experiences a decrease in the