Multiple Choice
 Refer to the graph above. When output increases from Q1 and the price level decreases from P1, this change will:
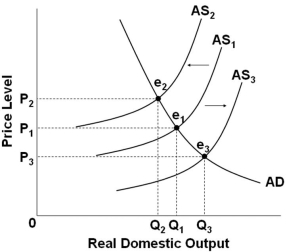
A) Be caused by a shift in the aggregate supply curve from AS1 to AS2
B) Be caused by a shift in the aggregate supply curve from AS1 to AS3
C) Result in a movement along the aggregate demand curve from e1 to e2
D) Result in a movement along the aggregate demand curve from e3 to e1
Correct Answer:

Verified
Correct Answer:
Verified
Q23: A decrease in aggregate supply means:<br>A) Both
Q24: The immediate-short-run aggregate supply curve is:<br>A) Vertical<br>B)
Q25: An aggregate supply curve represents the relationship
Q28: If the U.S. dollar appreciates in value
Q29: Answer the question based on the following
Q31: Answer the question based on the following
Q32: The intersection of the aggregate demand and
Q51: Macroeconomic equilibrium in the short run always
Q186: If the price level increases, then the
Q225: A decrease in personal and business taxes