Multiple Choice
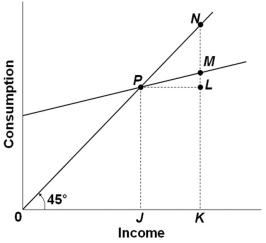 The graph above shows the relationship between consumption and income. Which of the following statements is correct?
A) The marginal propensity to consume in the economy shown is greater than 1
B) The marginal propensity to consume varies across income levels
C) The average propensity to consume at income level K is given by KM divided by KN
D) The marginal propensity to consume can be calculated by dividing LM by 0K
Correct Answer:

Verified
Correct Answer:
Verified
Q8: The slope of the consumption schedule between
Q9: If consumers expect prices to rise and
Q10: In a private closed economy, national income
Q11: A change in interest rates would shift
Q13: The investment demand curve is drawn with
Q14: The value of the multiplier is likely
Q15: In general, the steeper the consumption schedule
Q16: The disposable income (DI) and consumption (C)
Q17: If disposable income is $900 billion when
Q72: The marginal propensity to consume is the