Multiple Choice
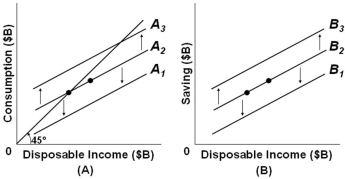
 Refer to the above figures with consumption schedules in figure (A) and saving schedules in figure (B) , which correspond to each other across different levels of disposable income. If, in figure (A) , consumption increases along line A2 then in figure (B) there would be:
A) A shift from line B2 to B3
B) A shift from line B2 to B1
C) A movement down along line B2
D) A movement up along line B2
Correct Answer:

Verified
Correct Answer:
Verified
Q4: An increase in taxes will shift both
Q58: The wealth effect will tend to decrease
Q82: Answer the following question based on the
Q84: During the Great Recession of 2007-2009, real
Q86: If there is a decrease in disposable
Q88: If disposable income decreases from $1800 to
Q90: Assume that an increase in a household's
Q91: The disposable income (DI) and consumption (C)
Q92: As the consumption and saving schedules relate
Q166: An increase in business taxes will tend