Multiple Choice
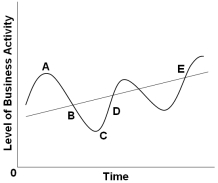 Refer to the diagram above. The straight line E drawn through the wavy lines would provide an estimate of the:
A) Recession fluctuation
B) Economic growth trend
C) Natural rate of unemployment
D) Recovery trend
Correct Answer:

Verified
Correct Answer:
Verified
Related Questions
Q3: Anyone who is not employed is classified
Q125: The higher the rate of unemployment:<br>A) The
Q126: The unemployed are those people who:<br>A) Do
Q127: If the actual rate of unemployment is
Q128: Unemployment that occurs when there is deficient
Q130: The recurrent ups and downs in the
Q131: Which of the following groups has traditionally
Q132: If the Consumer Price Index for a
Q133: Inflation is a rise in:<br>A) The general
Q134: Which of the following countries experienced deflation