Multiple Choice
 Refer to the graphs above. Which of the following best represents negative demand shock when prices are inflexible?
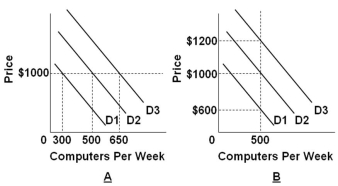
A) The shift from D2 to D3 in graph B
B) The shift from D2 to D3 in graph A
C) The shift from D2 to D1 in graph B
D) The shift from D2 to D1 in graph A
Correct Answer:

Verified
Correct Answer:
Verified
Q22: Savings are generated when current consumption is
Q73: For many decades prior to the Industrial
Q76: Who are the main economic investors in
Q77: In earlier centuries, the Roman and Chinese
Q79: <img src="https://d2lvgg3v3hfg70.cloudfront.net/TB4895/.jpg" alt=" Refer to the
Q80: Rapid and sustained economic growth of nations:<br>A)
Q82: If prices of goods and services quickly
Q83: The Great Recession occurred in:<br>A) 1970-74<br>B) 1985-87<br>C)
Q124: Suppose that prices are sticky in the
Q174: Which of the following statements is true?<br>A)Short-run