Multiple Choice
The question below are based on the following four sets of data-pairs: (1) A and B, (2) C and D, (3) E and F, and (4) G and H. In each set, the independent variable is in the left column and the dependent variable is in the right column. 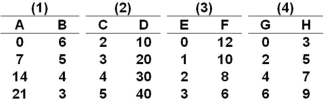 The slope of the linear graph that pictures data set 2 above is:
A) .10
B) 20
C) 5
D) 10
Correct Answer:

Verified
Correct Answer:
Verified
Q20: An assumption is usually made in a
Q162: A nation can produce two products: steel
Q163: Which of the following is another way
Q164: One major part of the opportunity costs
Q165: The role of an assumption in an
Q166: The slope of a graph that shows
Q168: If the opportunity cost of producing extra
Q169: In analyzing human decision and action, economists
Q170: Consider an economy that is producing inside
Q172: The question below are based on the