Multiple Choice
 Refer to the following table which shows the quantities of corn demanded at various levels of corn price (hypothetical data) .
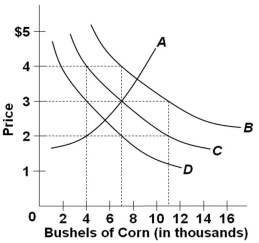
 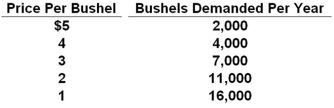 Which curve in the graph shown above best represents the data in the table?
A) A
B) B
C) C
D) D
Correct Answer:

Verified
Correct Answer:
Verified
Q60: Economic growth is shown as an increase
Q108: The law of increasing opportunity costs states
Q109: <img src="https://d2lvgg3v3hfg70.cloudfront.net/TB4895/.jpg" alt=" Refer to the
Q110: The question below are based on the
Q111: Economists have difficulty applying the scientific method
Q112: Assume that a consumer has a given
Q114: The economic principle that "unemployment rate will
Q116: The following graph is the production possibilities
Q117: A nation can produce two products: steel
Q118: A nation can produce two products: tanks