Multiple Choice
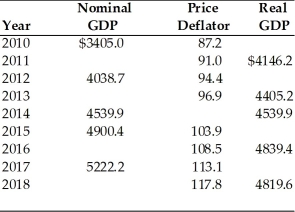
-Refer to the above table (figures in billions) . Between 2014 and 2015 real GDP
A) increased by $191.7 billion.
B) increased by $1.76 billion.
C) increased by $176.17 billion.
D) increased by $360.5 billion.
Correct Answer:

Verified
Correct Answer:
Verified
Related Questions
Q93: Suppose Country A and Country B each
Q94: Which of the following would NOT be
Q95: Mental or physical labor or help purchased
Q96: Given the following data, calculate the GDP.
Q97: Gross domestic product is<br>A) NDP plus net
Q99: To find the U.S. dollar equivalent of
Q100: Gross Domestic Product (GDP) exceeds net domestic
Q101: One of the principles behind the concept
Q102: The two main methods of measuring GDP
Q103: <img src="https://d2lvgg3v3hfg70.cloudfront.net/TB5018/.jpg" alt=" -According to the