Multiple Choice
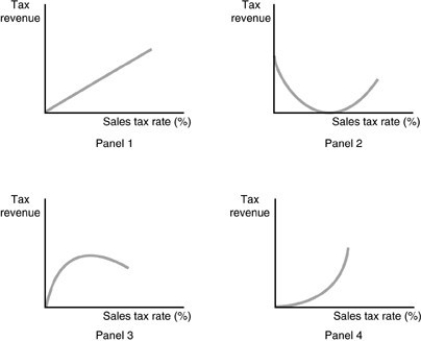
-Refer to the above figures. Which panel represents the expected relationship between tax revenue and the sales tax rate if dynamic tax analysis is used?
A) Panel 1
B) Panel 2
C) Panel 3
D) Panel 4
Correct Answer:

Verified
Correct Answer:
Verified
Related Questions
Q115: What determines the proportion of a unit
Q116: In order for the government to collect
Q117: A typical capital gain is experienced by<br>A)
Q118: Dynamic tax analysis is based on the
Q119: Briefly compare the three tax systems based
Q121: A 5 percent tax is going to
Q122: Which of the following statements about excise
Q123: Which of the following is subject to
Q124: Should the government wish to lower the
Q125: Jamal earns $160,000 per year and Josephina