Multiple Choice
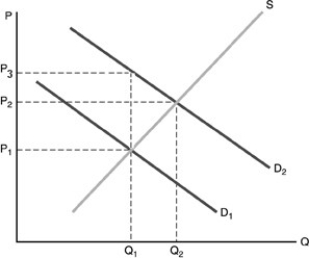
-Refer to the above figure. The market equilibrium quantity is Q1. Point Q2 represents the optimal amount of production. This indicates that there is
A) a public good which should be produced.
B) regressive taxation of the product.
C) a positive externality.
D) a negative externality.
Correct Answer:

Verified
Correct Answer:
Verified
Q126: The distinguishing characteristic of private goods is
Q127: Graphically, the effects of an external benefit
Q128: The non-exclusion principle means<br>A) no one can
Q129: The free-rider problem is<br>A) the use of
Q130: In the absence of government<br>A) public goods
Q132: In its most ideal form, a price
Q133: The purpose of antitrust legislation is<br>A) to
Q134: A payment that is made by the
Q135: <img src="https://d2lvgg3v3hfg70.cloudfront.net/TB5018/.jpg" alt=" A shift from
Q136: Government outlays include all of the following