Multiple Choice
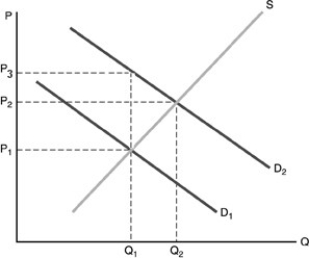
-Refer to the above figure. The market equilibrium quantity is Q1. Point Q2 represents the optimal amount of production. The government can achieve the optimal outcome by
A) setting the price at P3.
B) providing a per-unit subsidy to consumers equal to P3 - P1.
C) providing a per-unit subsidy to consumers equal to P2 - P1.
D) establishing a tax equal to P2 - P1 per unit of the good sold.
Correct Answer:

Verified
Correct Answer:
Verified
Q291: Public elementary and high school education in
Q292: A homeless family is given a government
Q293: Fred receives $14,000 per year from the
Q294: When does a subsidy that benefits consumers
Q295: Explain why ensuring economic stability is an
Q297: Which law specifically mandated the federal government's
Q298: The economic functions of the government deal
Q299: Graphically, the effect of a government subsidy
Q300: If the production of ukuleles creates a
Q301: Which of the following is TRUE about