Multiple Choice
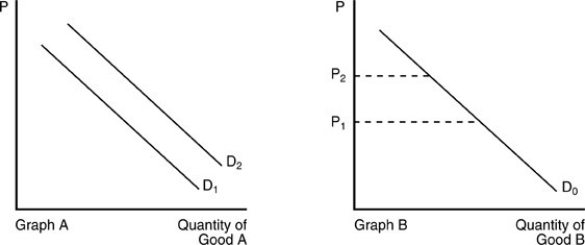
-In the above figure, when the price of Good B increases, the result can be shown by
A) the movement from D1 to D2 in Graph A.
B) the movement from D2 to D1 in Graph A.
C) the movement along D0 from P1 to P2.
D) the movement along D0 from P2 to P1.
Correct Answer:

Verified
Correct Answer:
Verified
Q85: Which of the following statements is FALSE?<br>A)
Q86: <img src="https://d2lvgg3v3hfg70.cloudfront.net/TB5018/.jpg" alt=" -Using the above
Q87: A shift of the demand curve to
Q88: Which of the following will NOT cause
Q89: All of the following will cause a
Q91: <img src="https://d2lvgg3v3hfg70.cloudfront.net/TB5018/.jpg" alt=" -According to the
Q92: If an increase in the incomes of
Q93: The price of a gallon of gasoline
Q94: If a good is a normal good,
Q95: In economic terminology, an inferior good is