Multiple Choice
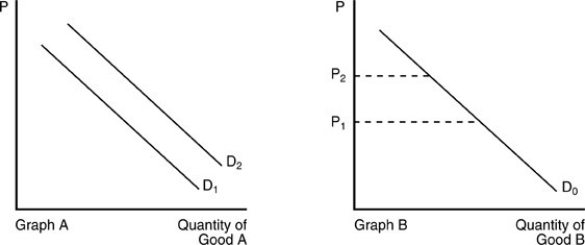
-In the above figure, an increase in income is best demonstrated by a
A) shift of D1 to D2 in Graph A, if good A is a normal good.
B) shift of D2 to D1 in Graph A, if good A is a normal good.
C) movement along D0 from P1 to P2 in Graph B.
D) movement along D0 from P2 to P1 in Graph B.
Correct Answer:

Verified
Correct Answer:
Verified
Related Questions
Q273: If a decrease in the price of
Q274: Suppose Good A is a normal good.
Q275: The money price of a good is
Q276: The price of a first-class stamp in
Q277: <img src="https://d2lvgg3v3hfg70.cloudfront.net/TB5018/.jpg" alt=" -Refer to the
Q279: The absolute price of a good is
Q280: The price of a commodity in terms
Q281: In deriving the demand schedule for a
Q282: Given the market data for good X
Q283: If the market price rises from P0