Multiple Choice
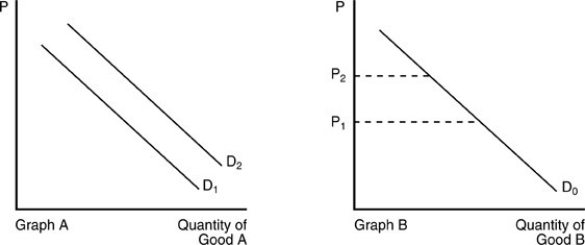
-In the above figure, the demand curve for Good A shifts from D1 to D2 in Graph A when the price of Good B changes from P1 to P2 in Graph B. We can conclude that
A) Good A and Good B are substitutes.
B) Good A and Good B are complements.
C) Good A is a normal good but Good B is an inferior good.
D) Good A and Good B are unrelated.
Correct Answer:

Verified
Correct Answer:
Verified
Q41: The demand for orthodontists' services falls as
Q42: What is the difference between a normal
Q43: An increase in price will lead to
Q44: Gasoline prices in the United States decreased
Q45: <img src="https://d2lvgg3v3hfg70.cloudfront.net/TB5018/.jpg" alt=" -According to the
Q47: An increase in demand for a good
Q48: Suppose an individual experiences a permanent increase
Q49: A direct or positive relationship between price
Q50: A technological improvement in the production of
Q51: <img src="https://d2lvgg3v3hfg70.cloudfront.net/TB5018/.jpg" alt=" -According to the