Multiple Choice

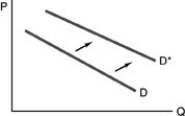
-Refer to the above figure. The rightward shift of the curve indicates
A) an increase in demand.
B) a decrease in demand.
C) an increase in quantity demanded.
D) a decrease in quantity demanded.
Correct Answer:

Verified
Correct Answer:
Verified
Related Questions
Q359: The law of demand implies that the
Q360: According to the above figure, a shortage
Q361: The alternative quantities demanded for a given
Q362: Graphically, a market demand curve is found
Q363: A subsidy to wheat farmers will<br>A) increase
Q365: Which of the following is an example
Q366: When the price of a good rises,
Q367: The price that we observe in the
Q368: <img src="https://d2lvgg3v3hfg70.cloudfront.net/TB5018/.jpg" alt=" -Refer to the
Q369: Assuming that turkey, chicken, pork, and beef