Multiple Choice
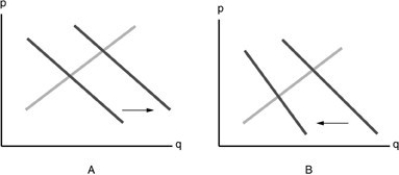
-Refer to the above figure. Suppose that Cheerios and Apple Jacks are substitutes. Which diagram shows the effect on the demand for Cheerios when the price of Apple Jacks cereal has decreased?
A) A
B) B
C) neither graph
D) both graphs
Correct Answer:

Verified
Correct Answer:
Verified
Q432: In 1950, a phone call at a
Q433: The price of cookies in terms of
Q434: The law of supply implies that the
Q435: Graphically, the market supply curve is obtained
Q436: Which of the following causes an increase
Q438: An increase in the relative price of
Q439: <img src="https://d2lvgg3v3hfg70.cloudfront.net/TB5018/.jpg" alt=" -At a price
Q440: <img src="https://d2lvgg3v3hfg70.cloudfront.net/TB5018/.jpg" alt=" -If there is
Q441: An decrease in demand is represented by
Q442: A demand curve<br>A) slopes down because of