Multiple Choice
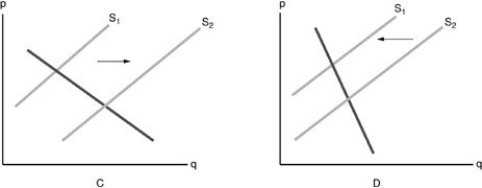
-Refer to the above figure. Plastic is an input for producing cellphones. Which diagram shows the effect on the supply of cellphones when the price of plastic has increased?
A) graph C
B) graph D
C) neither graph
D) both graphs
Correct Answer:

Verified
Correct Answer:
Verified
Related Questions
Q303: After the price of smartphone apps falls,
Q304: Which of the following will NOT cause
Q305: There will be an increase in supply
Q306: Which of the following statements is FALSE?<br>A)
Q307: Suppose that the price of cornflakes is
Q309: For typical goods, supply curves are<br>A) downward
Q310: Any improvement in overall production technology that
Q311: According to the law of supply<br>A) people
Q312: Which of the following would cause a
Q313: "A shortage is the same thing as