Multiple Choice
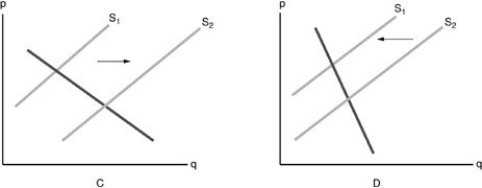
-Refer to the above figure. Which diagram shows the effect on the market of cellphones when the demand for cellphones has increased?
A) graph C
B) graph D
C) neither graph
D) both graphs
Correct Answer:

Verified
Correct Answer:
Verified
Q405: <img src="https://d2lvgg3v3hfg70.cloudfront.net/TB5018/.jpg" alt=" -Refer to the
Q406: <img src="https://d2lvgg3v3hfg70.cloudfront.net/TB5018/.jpg" alt=" -Refer to the
Q407: If consumers expect that the price of
Q408: Which of the following will NOT affect
Q409: The effects of a per-unit tax imposed
Q411: The price of a new car is
Q412: Refer to the above figure. The highest
Q413: Explain why there is a direct relationship
Q414: A given supply curve illustrates<br>A) the relationship
Q415: <img src="https://d2lvgg3v3hfg70.cloudfront.net/TB5018/.jpg" alt=" -Refer to the