Multiple Choice
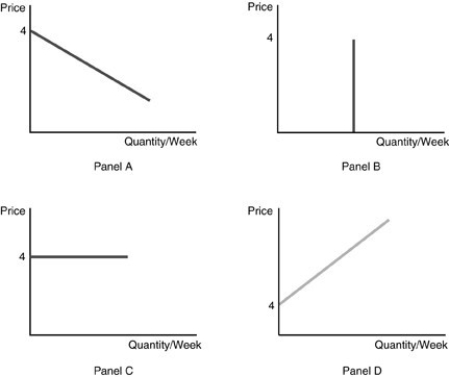
-Refer to the above figure. Which of the graphs represent the situation for a perfectly competitive industry?
A) Panel A
B) Panel B
C) Panel C
D) Panel D
Correct Answer:

Verified
Correct Answer:
Verified
Q386: When economic profits in a perfectly competitive
Q387: Each firm in a perfectly competitive industry
Q388: <img src="https://d2lvgg3v3hfg70.cloudfront.net/TB5018/.jpg" alt=" -In the above
Q389: <img src="https://d2lvgg3v3hfg70.cloudfront.net/TB5018/.jpg" alt=" -In the above
Q390: <img src="https://d2lvgg3v3hfg70.cloudfront.net/TB5018/.jpg" alt=" -Refer to the
Q392: A situation in which the price charged
Q393: For a perfectly competitive firm<br>A) price is
Q394: All of the following are characteristics of
Q395: In a perfectly competitive industry, which of
Q396: <img src="https://d2lvgg3v3hfg70.cloudfront.net/TB5018/.jpg" alt=" -In the above