Multiple Choice
Which of the following statements with respect to the figure below is INCORRECT? 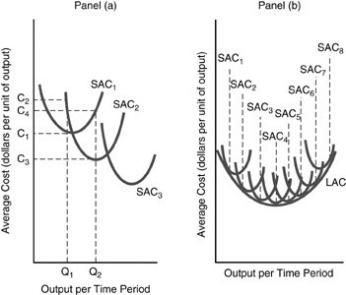
A) All the possible short-run average cost curves that correspond to the different plant sizes are shown as SAC1 - SAC8.
B) If the anticipated permanent rate of output per unit time period is Q1 in panel (a) , the optimal plant would correspond to SAC1.
C) If the permanent rate of output increases to Q2 in panel (a) , it will be more profitable to have a plant size corresponding to SAC3.
D) The long-run average cost curve LAC in panel (b) is sometimes called the planning curve representing the locus (path) of points.
Correct Answer:

Verified
Correct Answer:
Verified
Q374: <img src="https://d2lvgg3v3hfg70.cloudfront.net/TB5018/.jpg" alt=" -In the above
Q375: A horizontal long-run average cost curve indicates<br>A)
Q376: The long run is defined as a
Q377: The production function<br>A) shows the maximum level
Q378: As the quantity of labor increases while
Q380: <img src="https://d2lvgg3v3hfg70.cloudfront.net/TB5018/.jpg" alt=" -Refer to the
Q381: The minimum possible short-run average costs are
Q382: <img src="https://d2lvgg3v3hfg70.cloudfront.net/TB5018/.jpg" alt=" -Refer to the
Q383: When the minimum efficient scale occurs at
Q384: The change in total product occurring when