Multiple Choice
The minimum efficient scale in the figure below shows that 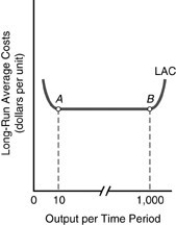
A) point A is the minimum efficient scale (MES) for the firm.
B) point B is the minimum efficient scale (MES) for the firm.
C) the long-run average cost curve (LAC) reaches a minimum point at B.
D) the minimum efficient scale (MES) illustrates maximum average costs.
Correct Answer:

Verified
Correct Answer:
Verified
Q207: What is the relationship between the marginal
Q208: What is a production function?
Q209: <img src="https://d2lvgg3v3hfg70.cloudfront.net/TB5018/.jpg" alt=" -In a map
Q210: The point of saturation occurs when a
Q211: <img src="https://d2lvgg3v3hfg70.cloudfront.net/TB5018/.jpg" alt=" -In the above
Q213: The addition to total costs associated with
Q214: "In the short run, a firm cannot
Q215: Minimum efficient scale<br>A) is the point at
Q216: <img src="https://d2lvgg3v3hfg70.cloudfront.net/TB5018/.jpg" alt=" -In the above
Q217: <img src="https://d2lvgg3v3hfg70.cloudfront.net/TB5018/.jpg" alt=" -Using the above