Multiple Choice
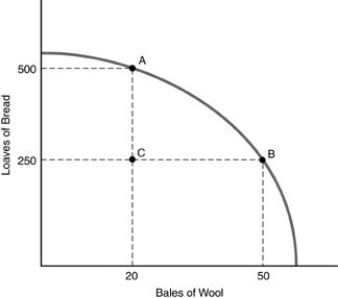
-Refer to the above figure. Which one of the following statements is TRUE with regard to the economy depicted in the graph?
A) Point C cannot be produced.
B) The best production point is 500 loaves of bread and 50 bales of wool.
C) The total amount of resources it takes to produce 20 bales of wool and 500 loaves of bread is more than the amount of resources needed to produce 50 bales of wool and 250 loaves of bread.
D) The total amount of resources it takes to produce 20 bales of wool and 500 loaves of bread is the same as the amount of resources needed to produce 50 bales of wool and 250 loaves of bread.
Correct Answer:

Verified
Correct Answer:
Verified
Q280: The conversion of resources into consumer goods
Q281: Comparative advantage is always a(n) _ concept.<br>A)
Q282: Two factories make wooden chairs. If the
Q283: The basic problem in economics is<br>A) unlimited
Q284: The making and selling of a pencil
Q286: A straight-line production possibilities curve takes this
Q287: Opportunity cost<br>A) can only be measured as
Q288: According to the above table, the opportunity
Q289: Which of the following is TRUE with
Q290: Which of the following will most likely