Multiple Choice
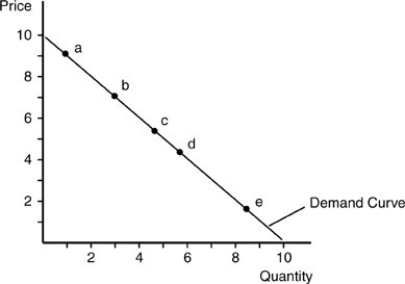
-In the above figure, along which range would total revenue rise by lowering prices?
A) between point a and point b
B) between point c and point d
C) between point d and point e
D) below point e
Correct Answer:

Verified
Correct Answer:
Verified
Related Questions
Q203: The cross price elasticity between A and
Q204: Graphically, what is the main difference between
Q205: Jill earns an income of $2,000 a
Q206: A perfectly elastic demand curve exhibits<br>A) zero
Q207: The price elasticity of demand shows<br>A) the
Q209: An elastic response in the quantity of
Q210: If the government places a $0.50 tax
Q211: The absolute price elasticity of demand for
Q212: For most goods and services the income
Q213: <img src="https://d2lvgg3v3hfg70.cloudfront.net/TB5018/.jpg" alt=" -Refer to the