Multiple Choice
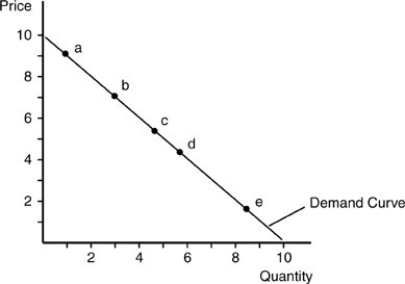
-In the above figure, along which range would total revenue rise by raising prices?
A) between point a and point b
B) between point c and point d
C) between point d and point e
D) above point a
Correct Answer:

Verified
Correct Answer:
Verified
Q181: Suppose that the number of units of
Q182: The price elasticity of demand measures<br>A) changes
Q183: If the bus fare of a city
Q184: When demand is unit elastic, an increase
Q185: <img src="https://d2lvgg3v3hfg70.cloudfront.net/TB5018/.jpg" alt=" -Refer to the
Q187: <img src="https://d2lvgg3v3hfg70.cloudfront.net/TB5018/.jpg" alt=" -In the above
Q188: "The income elasticity of a good is
Q189: Price elasticity of supply is always<br>A) positive
Q190: When demand is elastic<br>A) quantity demanded is
Q191: If the demand curve for a product