Multiple Choice
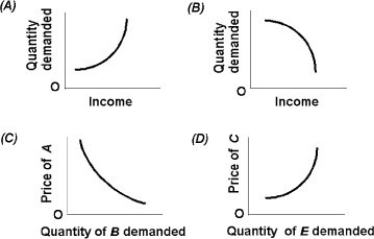
-Use the above figure. Which graph depicts complementary goods?
A) A
B) B
C) C
D) D
Correct Answer:

Verified
Correct Answer:
Verified
Related Questions
Q247: Suppose that the absolute price elasticity for
Q248: When demand is inelastic<br>A) quantity demanded is
Q249: If the market price of a product
Q250: <img src="https://d2lvgg3v3hfg70.cloudfront.net/TB5018/.jpg" alt=" -Refer to the
Q251: Which of the following is NOT characteristic
Q253: When demand is perfectly inelastic, the demand
Q254: If the absolute price elasticity of demand
Q255: A perfectly horizontal demand curve has<br>A) zero
Q256: If the price of good A increases
Q257: <img src="https://d2lvgg3v3hfg70.cloudfront.net/TB5018/.jpg" alt=" -Refer to the