Multiple Choice
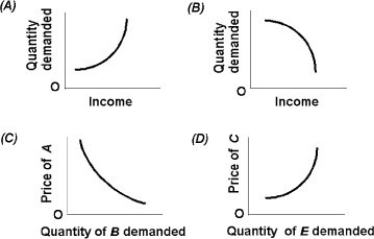
-Use the above figure. Which graph depicts substitute goods?
A) A
B) B
C) C
D) D
Correct Answer:

Verified
Correct Answer:
Verified
Related Questions
Q60: The actual value of price elasticity of
Q61: <img src="https://d2lvgg3v3hfg70.cloudfront.net/TB5018/.jpg" alt=" -In the above
Q62: In the long run, the supply curve<br>A)
Q63: When the price of a pound of
Q64: <img src="https://d2lvgg3v3hfg70.cloudfront.net/TB5018/.jpg" alt=" -In the above
Q66: Suppose that the demand for coffee is
Q67: If the price elasticity of supply of
Q68: A 10 percent increase in the price
Q69: <img src="https://d2lvgg3v3hfg70.cloudfront.net/TB5018/.jpg" alt=" -In the above
Q70: If the price elasticity of demand (Ep)