Multiple Choice
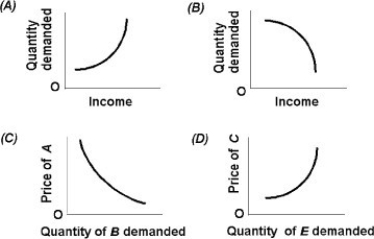
-Use the above figure. Which graph depicts an inferior good?
A) A
B) B
C) C
D) D
Correct Answer:

Verified
Correct Answer:
Verified
Related Questions
Q221: Price elasticity of demand is the responsiveness
Q222: <img src="https://d2lvgg3v3hfg70.cloudfront.net/TB5018/.jpg" alt=" -Refer to the
Q223: If the absolute price elasticity of demand
Q224: Absolute price elasticities are calculated for four
Q225: When the calculated price elasticity of demand
Q227: The price elasticity of supply<br>A) is the
Q228: For which of the following would the
Q229: <img src="https://d2lvgg3v3hfg70.cloudfront.net/TB5018/.jpg" alt=" -Refer to the
Q230: Why can cross price elasticity of demand
Q231: After full adjustment to a price change