Multiple Choice
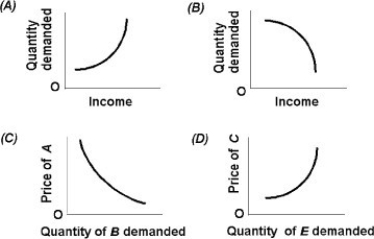
-Use the above figure. Which graph depicts a normal good?
A) A
B) B
C) C
D) D
Correct Answer:

Verified
Correct Answer:
Verified
Related Questions
Q38: If a 5 percent increase in price
Q39: The income elasticity of demand for all
Q40: An increase in total revenue will result
Q41: When the price of sausages is $2.00
Q42: If the absolute price elasticity of demand
Q44: When demand is elastic<br>A) changes in price
Q45: Suppose the price of A increases by
Q46: Usually, price elasticities of supply are<br>A) positive,
Q47: George always purchases the soda with the
Q48: The price of A falls by 2