Multiple Choice
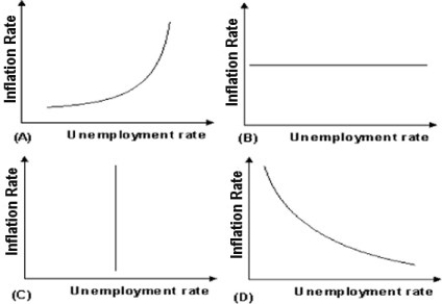
-Use the above figure. The long-run Phillips curve is best depicted by graph
A) A.
B) B.
C) C.
D) D.
Correct Answer:

Verified
Correct Answer:
Verified
Related Questions
Q120: What kind of relationship appears to actually
Q121: <img src="https://d2lvgg3v3hfg70.cloudfront.net/TB5018/.jpg" alt=" -Refer to the
Q122: Suppose that the inflation rate has been
Q123: The theory of new Keynesian inflation dynamics
Q124: New Keynesian inflation dynamics predicts that an
Q126: Deviations of the actual unemployment rate away
Q127: Under which of the following assumption can
Q128: What kinds of unemployment are associated with
Q129: An unexpected increase in aggregate demand causes<br>A)
Q130: Under the rational expectations hypothesis, if wages