Multiple Choice
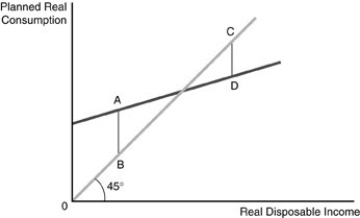
-Refer to the above figure. The figure represents the consumption function for a consumer. The distance between A and B represents
A) the amount of autonomous consumption.
B) the amount of autonomous saving.
C) the amount of total consumption.
D) none of the above.
Correct Answer:

Verified
Correct Answer:
Verified
Q251: In a closed economy, real Gross Domestic
Q252: The consumption function shifts upward when<br>A) real
Q253: Keynes thought that the key to determining
Q254: <img src="https://d2lvgg3v3hfg70.cloudfront.net/TB5018/.jpg" alt=" -In the above
Q255: <img src="https://d2lvgg3v3hfg70.cloudfront.net/TB5018/.jpg" alt=" -In the above
Q257: Dissaving occurs when<br>A) the amount of consumption
Q258: At a level of real disposable income
Q259: Which of the following is FALSE?<br>A) 1
Q260: In the Keynesian model, whenever planned saving
Q261: If the marginal propensity to consume (MPC)