Multiple Choice
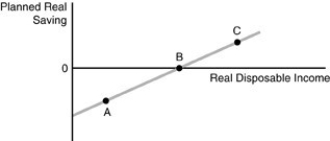
-Refer to the above figure. The figure represents the saving function for the consumer. Point B represents
A) the amount of autonomous consumption.
B) a situation in which saving is positive.
C) a situation in which saving is negative.
D) the point at which saving equals zero.
Correct Answer:

Verified
Correct Answer:
Verified
Q156: Investment is<br>A) a positive function of real
Q157: What effect would taxation have on real
Q158: As real disposable income decreases, consumption expenditures<br>A)
Q159: Which formula is correct?<br>A) Yd = S
Q160: Which of the following represents the relationship
Q162: In the graph for the consumption function,
Q163: <img src="https://d2lvgg3v3hfg70.cloudfront.net/TB5018/.jpg" alt=" -Refer to the
Q164: The relationship between planned consumption expenditures and
Q165: When a household's disposable income falls to
Q166: What happens as the interest rate rises?<br>A)