Multiple Choice
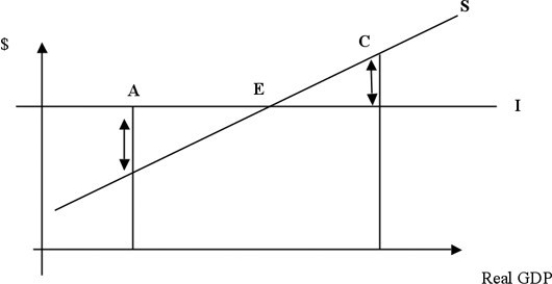
-In the above figure, point E represents the level of real GDP at which planned saving equals planned investment. At point C
A) unplanned inventories increase.
B) changes in inventories cannot be determined.
C) unused industrial capacity exists in the economy.
D) unplanned inventories decrease.
Correct Answer:

Verified
Correct Answer:
Verified
Q210: If the multiplier is 20 and income
Q211: The investment function is represented by<br>A) an
Q212: Which of the following statements is FALSE?<br>A)
Q213: The consumption function shows the relationship between
Q214: Savings are an example of<br>A) a flow
Q216: <img src="https://d2lvgg3v3hfg70.cloudfront.net/TB5018/.jpg" alt=" Note: Amounts in
Q217: <img src="https://d2lvgg3v3hfg70.cloudfront.net/TB5018/.jpg" alt=" -Refer to the
Q218: Which of the following statements is TRUE?<br>A)
Q219: In the above figure, saving will equal
Q220: The multiplier effect applies to any<br>A) change