Multiple Choice
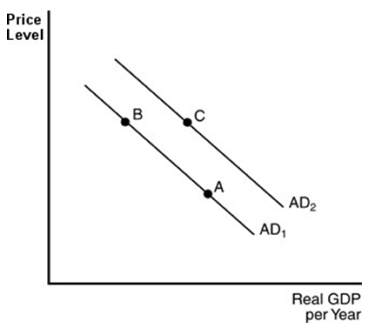
-In the above figure, a movement from point B to point C could be explained by
A) an increase in the price level.
B) a decrease in the quantity of money in circulation.
C) increased government spending.
D) the real-balance effect.
Correct Answer:

Verified
Correct Answer:
Verified
Q162: All of the following explain the downward
Q163: The curve that displays total planned real
Q164: According to the interest rate effect, an
Q165: What has caused persistent inflation in the
Q166: <img src="https://d2lvgg3v3hfg70.cloudfront.net/TB5018/.jpg" alt=" -Refer to the
Q168: When investors buy more capital goods because
Q169: In the aggregate demand/aggregate supply model, the
Q170: The aggregate demand curve would shift to
Q171: Which of the following will occur when
Q172: <img src="https://d2lvgg3v3hfg70.cloudfront.net/TB5018/.jpg" alt=" -Refer to the