Multiple Choice
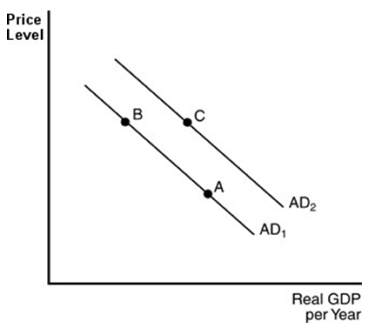
-In the above figure, a movement from point C to point B could be explained by
A) an increase in the price level.
B) an increase in the quantity of money in circulation.
C) increased government taxation.
D) the real-balance effect.
Correct Answer:

Verified
Correct Answer:
Verified
Related Questions
Q178: The long-run aggregate supply curve is<br>A) upward
Q179: Real GDP will increase over the long
Q180: Aggregate demand reflects<br>A) planned total spending in
Q181: Which of the following is the most
Q182: The aggregate supply curve<br>A) shows what each
Q184: The total level of all planned expenditures
Q185: When the price level is below the
Q186: Other things being equal, appreciation of the
Q187: What is measured on the vertical axis
Q188: Secular deflation occurs when<br>A) there is no