Multiple Choice
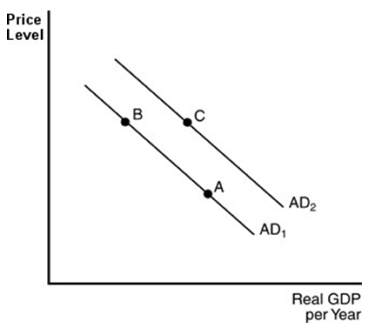
-In the above figure, a movement from point A to point B could be explained by
A) an increase in the price level.
B) an increase in the quantity of money in circulation.
C) a decrease in the price level.
D) a decrease in government spending.
Correct Answer:

Verified
Correct Answer:
Verified
Related Questions
Q92: When expenditures change due to changes in
Q93: Refer to the above figures. Which panel(s)
Q94: A rise in the price level has
Q95: Which of the following will NOT lead
Q96: The long-run aggregate supply curve will shift
Q98: When the relative prices of U.S.-manufactured goods
Q99: The aggregate demand curve will shift to
Q100: The change in total planned real expenditures
Q101: Steadily improving improvements in technology, other things
Q102: A fall in the price level<br>A) increases