Essay
The alternatives 1 and 2 in the following payoff table represent the two possible manufacturing strategies that the EKA manufacturing company can adopt.The level of demand affects the success of both strategies.The states of nature (SI)represent the levels of demand for the company products.S1,S2,and S3 characterize high,medium,and low demand respectively.The payoff values are in thousands of dollars. 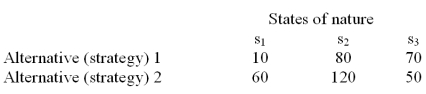 The management believes that the weather conditions significantly affect the level of demand.48 monthly sales reports are randomly selected.These monthly sales reports showed 15 months with high demand,28 months with medium demand,and 5 months with low demand.12 of the 15 months with high demand had favorable weather conditions.14 of the 28 months with medium demand had favorable weather conditions.Only 1 of the 5 months with low demand had favorable weather conditions.Based on this information,the prior probabilities have been revised.If the weather conditions are favorable,P(S1)= .4286,P(S2)= .5357,and P(S3)= .0357,and if the weather conditions are poor,P(S1)= .1364,P(S2)= .6818,and P(S3)= .1818.It is also determined that the probability of favorable weather is 0.56 and the probability of poor weather is 0.44.
Determine the expected value of sample information.What is the maximum amount that the company is willing to pay for the weather information and the additional analysis?
Correct Answer:

Verified
EVSI = 0.5 or $500
If the weather condit...View Answer
Unlock this answer now
Get Access to more Verified Answers free of charge
Correct Answer:
Verified
If the weather condit...
View Answer
Unlock this answer now
Get Access to more Verified Answers free of charge
Q30: _ statistics is an area of statistics
Q31: A pharmaceutical company manufacturing pregnancy test kits
Q32: The alternatives 1 and 2 in the
Q35: The quality control manager for the NKA
Q36: The alternatives 1 and 2 in the
Q39: The alternatives 1 and 2 in the
Q43: When we assess the worth of sample
Q45: Maximin is a criterion used when making
Q76: In utility analysis, a utility curve that
Q80: Maximax is a criterion used when making