Multiple Choice
For eight randomly selected states,the following table lists the per capita beer consumption (in gallons) and the per capita wine consumption (in gallons) 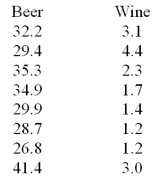
Test H0: ps = 0 vs HA: ps > 0 for the relationship between beer consumption and wine consumption at the state level at = .05.
A) Reject the null hypothesis
B) Fail to reject the null hypothesis
Correct Answer:

Verified
Correct Answer:
Verified
Q53: An assumption of the Wilcoxon rank sum
Q70: The Spearman's rank correlation test can be
Q75: Parametric methods are _ more powerful than
Q87: The EPA has stipulated that the
Q88: Given the following sample data: .980,1.01,.970,.990,1.00,1.00,.980,.970,.980,and
Q90: Five years ago,the average starting salary of
Q91: A study was conducted to investigate the
Q92: A study was conducted to investigate the
Q93: Two NFL scouts are in the
Q99: If the population from which we sample