Multiple Choice
A foreman wants to use an  chart to control the average length of the bolts manufactured.He has recently collected the six samples given below.
 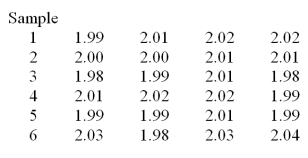 Determine the LCL and the UCL for the R chart.
A) (0 .0685)
B) (0 .076)
C) (0 .03)
D) (0 .0601)
Correct Answer:

Verified
Correct Answer:
Verified
Q26: A unit that fails to meet specifications
Q27: A(n)_ process has the ability to produce
Q52: A motorcycle manufacturer produces the parts for
Q54: A fastener company produces bolts with
Q55: When employing measurement data to study a
Q56: If 20 samples of size 7 are
Q58: If <img src="https://d2lvgg3v3hfg70.cloudfront.net/TB1737/.jpg" alt="If =
Q59: For a manufacturing process, <img src="https://d2lvgg3v3hfg70.cloudfront.net/TB1737/.jpg" alt="For
Q62: As the standard deviation of a process
Q64: How well a process is able to