Multiple Choice
Suppose that  and R charts are based on subgroups of size four are being used to monitor the tire diameter size of a new radial tire manufactured by a tire company.The
  and R charts are found to be in statistical control with
 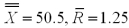 inches.A histogram of the tire diameter measurements indicates that distribution of these measurements is approximately normally distributed.Compute the natural tolerance limits for this process.
A) (48.68 52.32)
B) (49.89 51.11)
C) (48.86 52.14)
D) (46.75 54.25)
Correct Answer:

Verified
Correct Answer:
Verified
Q39: Unusual sources of process variation that can
Q112: A powder metal manufacturing company is
Q113: Consider two processes.Process 1's mean is equal
Q114: A fastener company produces bolts with
Q115: A powder metal manufacturing company is
Q116: The quality of an electronic component used
Q117: Among other quality measures,the quality of an
Q119: For a given control chart,zone boundaries consist
Q121: If <img src="https://d2lvgg3v3hfg70.cloudfront.net/TB1737/.jpg" alt="If =
Q122: Suppose that <img src="https://d2lvgg3v3hfg70.cloudfront.net/TB1737/.jpg" alt="Suppose that