Essay
Consider the following set of quarterly sales data given in thousands of dollars. 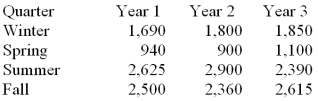 The following dummy variable model that incorporates a linear trend and constant seasonal variation was used: y (t)= B0 + B1t + BQ1(Q1)+ BQ2(Q2)+ BQ3(Q3)+ Et
In this model there are 3 binary seasonal variables (Q1,Q2,and Q3).
Where
Qi is a binary (0,1)variable defined as:
Qi = 1,if the time series data is associated with quarter i;
Qi = 0,if the time series data is not associated with quarter i.
The results associated with this data and model are given in the following MINITAB computer output.
The regression equation is
Sales = 2442 + 6.2 Time - 693 Q1 - 1499 Q2 + 153 Q3 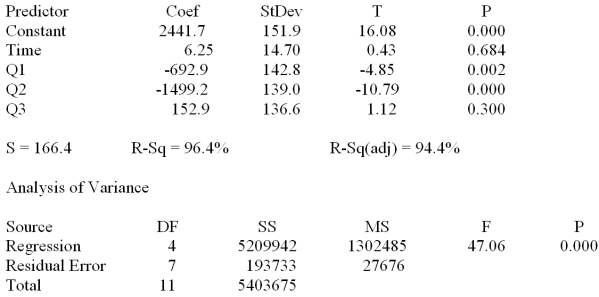 Provide a managerial interpretation of the regression coefficient for the variable "time."
Correct Answer:

Verified
It is estimated that...View Answer
Unlock this answer now
Get Access to more Verified Answers free of charge
Correct Answer:
Verified
View Answer
Unlock this answer now
Get Access to more Verified Answers free of charge
Q3: The purpose behind moving averages and centered
Q46: Consider the quarterly production data (in thousands
Q47: Assume that the current date is February
Q48: Consider the following set of quarterly
Q49: The price and quantity of several food
Q50: Use the following information for the three
Q52: Given the following data <img src="https://d2lvgg3v3hfg70.cloudfront.net/TB1737/.jpg" alt="Given
Q54: Paasche index more accurately provides a year-to-year
Q120: While a simple index is calculated by
Q155: The _ component of a time series