Essay
Consider the quarterly production data (in thousands of units)for the XYZ manufacturing company below.The normalized (adjusted)seasonal factors are .9982,.9263,1.139,.9365 for winter,spring,summer and fall respectively. 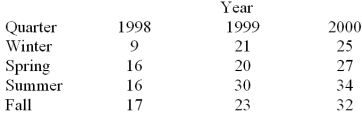 Based on the following deseasonalized observations (dt)given below,a trend line was estimated.
 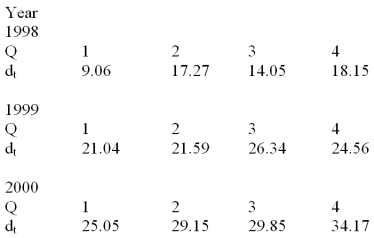 The following MINITAB output gives the straight-line trend equation fitted to the deseasonalized observations.Based on the trend equation given below,calculate the trend value for each period in the time series.
The regression equation is
Deseasonalized = 10.1 + 1.91 Time 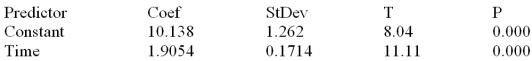
Correct Answer:

Verified
12.01,13.91,15.82,17.72,19.63,...View Answer
Unlock this answer now
Get Access to more Verified Answers free of charge
Correct Answer:
Verified
View Answer
Unlock this answer now
Get Access to more Verified Answers free of charge
Q5: A positive autocorrelation implies that negative error
Q22: A restaurant has been experiencing higher sales
Q24: <img src="https://d2lvgg3v3hfg70.cloudfront.net/TB1737/.jpg" alt=" Based on the
Q25: The linear regression trend model was
Q26: The price and quantity of several food
Q28: <img src="https://d2lvgg3v3hfg70.cloudfront.net/TB1737/.jpg" alt=" Based on the
Q29: The upward or downward movement that characterizes
Q30: Consider the quarterly production data (in thousands
Q31: If a time series exhibits increasing seasonal
Q32: In the multiplicative decomposition method,the centered moving