Essay
The manufacturer of a light fixture believes that the dollars spent on advertising,the price of the fixture and the number of retail stores selling the fixture in a particular month,influence the light fixture sales.The manufacturer randomly selects 10 months and collects the following data: 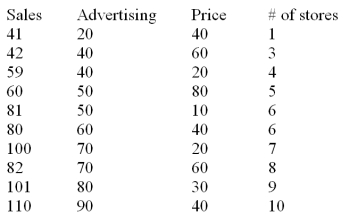 The sales are in thousands of units per month,the advertising is given in hundreds of dollars per month,and the price is the unit retail price for the particular month.Using MINITAB the following computer output is obtained.
The regression equation is
Sales = 31.0 + 0.820 Advertising - 0.325 Price + 1.84 Stores 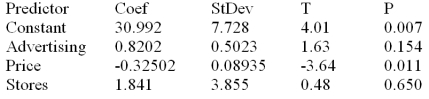 S = 5.465 R - Sq = 96.7% R - Sq(adj)= 95.0%
Analysis of Variance 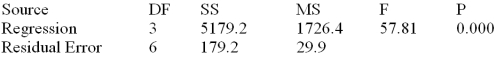 Based on the multiple regression model given above,the point estimate of the monthly light fixture sales corresponding to second sample data is 49.82 or 49,820 units.This point estimate is calculated based on the assumption that the company spends $4000 on advertising,the price of the fixture is $60 and the fixture is being sold at 3 retail stores.Additional information related to this point estimate is given below.
  Determine the 95% confidence interval for this point estimate and interpret its meaning.
Correct Answer:

Verified
41.183 to 58.457.We are 95% confident th...View Answer
Unlock this answer now
Get Access to more Verified Answers free of charge
Correct Answer:
Verified
View Answer
Unlock this answer now
Get Access to more Verified Answers free of charge
Q38: Consider the following partial computer output for
Q39: A member of the state legislature has
Q40: Below is a partial multiple regression ANOVA
Q41: Consider the following partial computer output for
Q42: The graph of the prediction equation obtained
Q44: Consider the following partial computer output for
Q45: An investigator hired by a client
Q46: A member of the state legislature
Q47: A member of the state legislature
Q73: The range of feasible values for the