Multiple Choice
Consider a set of 50 measurements with mean 50.2 and standard deviation 18.7 and with the following observed frequencies. 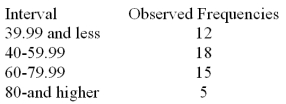 It is desired to test whether these measurements came from a normal population. Calculate the expected frequency for the interval 40-59.99.
A) 20.37
B) 18.00
C) 14.56
D) 12.50
Correct Answer:

Verified
Correct Answer:
Verified
Q80: When we carry out a goodness-of-fit chi-square
Q86: Consider the 3X2 contingency table below. <img
Q87: In a study of car accidents and
Q88: In a contingency table,when all the
Q89: In a study of car accidents and
Q90: Which if any of the following statements
Q91: A multinomial probability distribution describes data that
Q93: In the past,of all the students enrolled
Q94: A manufacturing company produces part 2205 for
Q96: While a binomial distribution describes a count