Multiple Choice
The following frequency table summarizes the ages of 60 shoppers at the local grocery store. 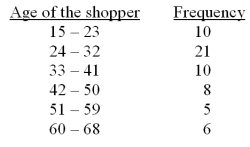 Calculate the approximate sample mean for this data (mean for the grouped data) .
A) 37.50 years
B) 36.25 years
C) 32.25 years
D) 40.25 years
E) 45.50 years
Correct Answer:

Verified
Correct Answer:
Verified
Related Questions
Q62: The _ is a quantity that measures
Q74: Using Chebyshev's Rule,find the interval that contains
Q75: A disadvantage of using grouping (a frequency
Q76: Quality control is an important issue at
Q77: In a statistic class,10 scores were randomly
Q79: According to a survey of the top
Q80: In a statistic class,10 scores were randomly
Q81: In a hearing test,subjects estimate the loudness
Q83: The local amusement park was interested in
Q136: The population variance is the average of